Paraplex

Dot lattice

by Paraplex
Dot lattice

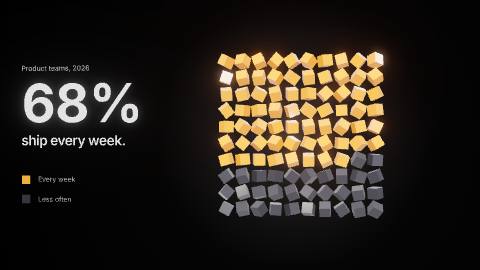
A hundred glossy cubes tumble out of chaos into a ten-by-ten grid, then cube after cube turns orange as the share counts up beside them, with a short label and a color key. A waffle chart for one striking stat in a deck, report or post: set your own share, words and colors.

Price
Free
Shape
16:9
Length
6 s
Category
Infographics
Published
2026-09-18
Last updated
2026-10-06

Use template

More in Infographics

  • Stat drop — A label slides up, then a big number counts up like an odometer and lands on a downbeat, with a short caption under it. A phone rises from…
  • The AI ROI gap — A narrated documentary Short in white clay on black: forty billion dollars as a pile of paper, ninety-five of a hundred companies in red…
  • Chart drop — A revenue total counts up beside a short headline while four bars grow in one after another, each value appearing over its bar as it…
  • Cloud of things — A cloud of gold coins swirls, then gives way to three piles that grow coin by coin to split a budget, each share counting up as it rides…